I have spent years forecasting software and SaaS company financials. One area of the P&L that receives extra scrutiny from leadership and investors is the sales and marketing area.
It’s easy to get lost in a sea of SaaS metrics, but in this post, I’ll focus on a couple easy and popular (meaning important) SaaS sales efficiency metrics that will help you gauge the efficiency of your sales and marketing process.
Sales Metric #1 – Cost of Net New ARR
Let’s dive right into a metric that gets to the heart of sales efficiency. That is the cost of net new ARR (annual recurring revenue).
First, what is net new ARR? Net new ARR equals ARR from new business acquisition and the incremental ARR from expansion and upsell. Please do not include any normal renewals in this number. It’s just the net ARR coming into your business.
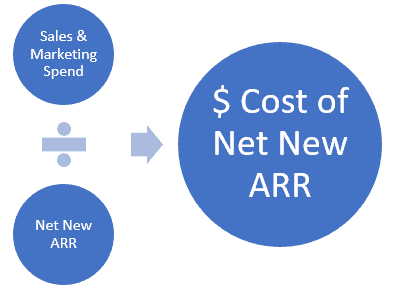
Cost of Net New ARR Formula
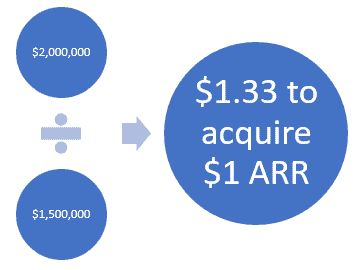
You simply divide your total sales and marketing spend by your net new ARR bookings. What results is the cost to acquire one net new dollar of ARR. You can measure this by month, quarter, YTD, or year. Just select a long enough time period to minimize any month-to-month volatility that might skew the result.

Why The Cost of ARR is a Great Metric
This metric is great for two reasons. It doesn’t require a mature accounting process or a bunch of reports. You just need your total sales and marketing spend and bookings. Secondly, it’s simple and informs you immediately about your acquisition efficiency. Not much room for debate.

Net new ARR is the life source for any SaaS business, so you should be tracking this number. And even if you have a basic QuickBooks P&L by expense category, you should be able to isolate your sales and marketing spend. Though, wages might be tricky if they are in one bucket.
Your sales and marketing spend should be fully burdened. This includes sales and marketing wages, taxes, benefits, commissions, advertising, trade shows, conferences, swag, travel, etc. You might need the help of your bookkeeper or accountant to cull out the related general ledger transactions if your expenses are categorized generically.
This post sponsored by TrueRev.com
Trouble Finding your Sales and Marketing Spend?
If finding your exact sales and marketing spend is difficult, please check out my posts on how to structure your SaaS chart of accounts. If you are at several million dollars of ARR, I recommend coding your expenses to the department level. It makes this calculation a breeze and repeatable.
SaaS Benchmarks
What’s also great about this sales efficiency metric (actually, a third reason) is that you can then compare your number to KeyBanc’s SaaS Private SaaS Company survey.
To spoil the surprise, the cost to acquire $1 dollar of new logo ARR is $1.15 (median). The cost to acquire $1 of new expansion revenue is $0.57 (median). I highly recommend that you download this survey as there is some great comparative data on SaaS metrics and other important financial measures.
Sales Metric #2 – CAC Payback Period
Now that we have our cost of net new ARR, it’s easy to add one more step to this formula to derive your overall CAC Payback Period in months. To be technically correct, we are going to be calculating your net ARR payback period.
You just need to know your recurring revenue margin. To learn more about margins, check out my post on how to calculate your SaaS gross margin and recurring revenue margin.
Net ARR Payback Period Formula
This is a little different take on CAC Payback. Typically, you think of payback for just new customer acquisition. The traditional CAC payback formula requires that you isolate your sales and marketing spend to just new logo acquisition.
However, with the Net ARR payback formula, it is much easier to implement into your monthly reporting, because you are calculating your payback period for both new and existing ARR combined. No need to allocate your S&M spend to new versus existing.
This is any easy extension off the cost of ARR formula above. The new variable that we are adding to the equation is your recurring revenue margin. And make sure you observe the parentheses below when calculating.


Conclusion
There’s a big difference in understanding the theory of SaaS metrics and actually implementing them in your day-to-day operations. I really believe the sales efficiency metrics above can be incorporated into your monthly reporting with relative ease.
If not, make the couple required changes in your accounting process so that you can calculate these metrics. You’ll have to as you scale, so do it now while you have time (assuming you do!).
What sales efficiency metrics are you using? Let me know below.
I have worked in finance and accounting for 25+ years. I’ve been a SaaS CFO for 9+ years and began my career in the FP&A function. I hold an active Tennessee CPA license and earned my undergraduate degree from the University of Colorado at Boulder and MBA from the University of Iowa. I offer coaching, fractional CFO services, and SaaS finance courses.


Great post! At Growth Street, we also like to break these calculations out by customer segment, allowing us to see (and continue to target) our best customers.
Another thing we are experimenting with is splitting out the “sales” portion of account management from the maintenance portion in our CoA. That way we can get a better idea of the true dollars invested in generating net new ARR.
What are your thoughts about non-SaaS revenue (e.g. professional services, or potential usage/overage revenue) and their value in this equation? There is also some timing issues with this right, as S&M cost is today, and ARR which includes future cash flows?
Hi Peter,
I exclude services from the equation. Services are important, but are typically a by-product of selling subscriptions. I look at attachment rates (subscriptions to services).
Yes, there is some timing. You want to measure this based on your sales cycle. If a longer sales cycle, you’d include more months in your calculation, for example.
For CAC, how do you calculate recurring revenue margin?
Hi David, check out the post below.
https://www.thesaascfo.com/how-to-calculate-saas-gross-margin/
Hi Ben,
Do you account for churn in your definition of Net ARR? Example: If my S&M cost was 1M/year and brought in 2M/year in gross ARR(new+expansions), but I lost 1M due to churn from the existing accounts, what is my sales efficiency?
Thanks!
Hi Andrey,
No, I do not include churn when calculating the sales and marketing efficiency of acquiring net ARR. Churn is factored into net retention and a focus for customer success (and the entire org).
Regards,
Ben
My company throws every S&M expense into the denominator to calculate Sales Efficiency (the numerator is Net New ACV). That said, many of my employees (within Sales) and many of the costs (within Marketing) are responsible for existing client acquisition NOT new client acquisition. What is best practice?
Hi Brett,
If you are calculating your total cost of ARR or ACV, then yes, throw all sales and marketing into the denominator. But if you would like to distinguish between new and existing acquisition, you need to allocated your S&M expense between new and existing. For sales, I allocate based on the ratio of new business reps to account managers. For marketing, you really need to ask your marketing leader about their efforts.
Ben
Hi Ben,
If you have a mix of monthly / Annual billing are you taking the New MRR for the month and multiplying by 12?
Similarly there is no mention of Contraction in the above (for example where you have per user pricing). Do you factor this into the Calc also?
Thanks