Sample Chart of Accounts for SaaS
I’ve received quite a few requests about a sample chart of accounts for SaaS, so let’s address a super critical component of your accounting. Not a “fun” topic per se, but you need to understand the concept behind your chart of accounts and implement the correct structure if you want to truly understand the financial health of your SaaS business.
Why is This Important
Ugh, I know that I am talking about accounting here, but you won’t be able to produce a proper SaaS P&L and the related SaaS metrics without doing the following. This article is intended for everyone, but it is critical for founders, staff accountants, and financial analysts. The sample chart of accounts can be downloaded below.
What is a Chart of Accounts
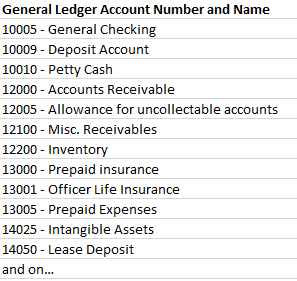
A chart of accounts, often abbreviated as COA, is simply a numerical and descriptive listing of all the accounts on your general ledger from the balance sheet to the income statement (aka P&L). The numbers typically start at 1XXXX (can be for 4 or 5-digit) and end at 9XXXXX.

Ok, now what the heck is a general ledger? The general ledger is where your accountant or bookkeeper records the debits and credits. It contains the history of your financial transactions and forms the basis of your financial statements.
In summary, a chart of accounts defines the structure and grouping of your accounts and the general ledger (GL) is where the transactions occur.
Sample Chart of Accounts Structure
Below I define a sample structure of your chart of accounts. Yours may a look a little different, but it gives you an idea of the categories.
1XXXX – Balance Sheet – Assets
2XXXXX – Balance Sheet – Liabilities
3XXXXX – Balance Sheet – Stockholder’s Equity
4XXXXX – Income Statement – Revenue
5XXXXX – Income Statement – Cost of Goods Sold (COGS)
6XXXXX – Income Statement – Operating Expenses
7XXXXX – Income Statement – Non-operating Expenses
Think of the general ledger as one long piece of paper where your bookkeeper or accountant is recording journal entries to these accounts. Also, you may hear your finance team refer to a trial balance. This is simply a report or download of the numerical balances in all your general ledger accounts.
Still with me? This is fundamental accounting, but just coding expenses and revenue to GL accounts is not enough to produce a proper SaaS income statement and the relevant SaaS metrics.
The Next Step
To produce financials and metrics that truly tell you the health of your SaaS business, you must code (the debits and credits) your revenue and expenses to more than just a GL account number (for example, 60000 – Wages).
Your auditors only care that you are posting to the correct general ledger account. If you miscoded marketing’s travel to G&A, they don’t care, but you should.
So, you must attach your expense entry to the department generating that expense. If you post all your wages to one big bucket of expense, for example, you will never be able to calculate metrics, determine your gross margin, or understand if you are better or worse than budget.
The Next Dimension – Department Structure
Coding to the next level of detail beyond the GL account is like metadata. Typically, I hear this referred to as a “dimension” in your chart of accounts. So, when I code wage expenses, I tag the GL account, let’s say 60000, and then dimension #1, which in my case is a department number (for example, 100 – Sales).
Common SaaS Department Structure
The departments (aka cost centers) listed below would be the minimum structure that I would suggest to create a proper SaaS P&L. With this structure, you can also pull out the relevant data to calculate important SaaS metrics.
- Field Services
- Customer Success
- Technical Support
- Cost of Operations
- Development
- Sales
- Marketing
- G&A (HR, accounting, executives, IT)
- Non-operating
Coding Revenue
What about coding revenue? This is a little easier. You can sometimes get away with coding different product revenue to different GL accounts.
But if you have several subscription products, you can also create a profit center (like a department and a much cleaner way to do it) and post a product’s revenue to the relevant GL account and profit center.
This method makes it much easier to pull reports without a lot of manipulation and determine product line profitability.
Takeaway
Thanks for staying with me on this topic. Please remember this takeaway. Make sure you are coding your expenses to the department level in your general ledger. It’s common and quite necessary in order to produce actionable financial statements and metrics.
Let me know below. Do you currently post your expenses to the department level?
You can download a sample chart of accounts below.
I have worked in finance and accounting for 25+ years. I’ve been a SaaS CFO for 9+ years and began my career in the FP&A function. I hold an active Tennessee CPA license and earned my undergraduate degree from the University of Colorado at Boulder and MBA from the University of Iowa. I offer coaching, fractional CFO services, and SaaS finance courses.

Hi Ben,
Can you provide definitions and examples for the Common SaaS Department Structures above?
Thank you!
Mark
Hi Mark,
These are common SaaS departments. I tagged a COGS (in gross margin) or OpEx.
Field Services (COGS)
Customer Success (COGS)
Technical Support (COGS)
Cost of Operations (COGS)
Development (OpEx)
Sales (OpEx)
Marketing (OpEx)
G&A (HR, accounting, executives, IT) (OpEx)
Non-operating
Hi Ben,
Appreciate your insight. Just curious if you’ve seen a split amongst SaaS companies when it comes to Customer Success. I’ve worked at places where we’ve classified the full CS expense as COGS and at other places where we’ve taken the majority as OPEX and allocated the customer facing portion (implementation hours) up to COGS. Obviously the bottom line is the same, but depending on the method, it can swing your margins…
Hi Jonny,
Yes, if customer success sells, then I code them to Sales in OpEx. If they onboard customers or focus on retention, then I code them to COGS.
Ben
Hi Ben
do you have definitions for What is R&D Or product Development VS COGS for software products?
im working with a start up who has 3 years of time and expenses to bring a product to market, and are just starting to make sales.
Hi Barry, yes, R&D expenses will fall below gross profit in the OpEx section of your SaaS P&L.