CAC Payback Period vs. LTV/CAC
This post was inspired by a SaaS metrics question posted on Quora. The user asks, “what is more important? CAC Payback Period or LTV/CAC?” Great question, but it left me scratching my head, because it’s a difficult question to answer anecdotally. Both are important in your SaaS business but should you emphasize one metric over the other? If one metric improves, does the other metric improve correspondingly?
I’ve written posts on the CAC Payback Period and the LTV/CAC ratio, so it was time to dust off the spreadsheets and see how these two metrics work together.
Formula Review
If you are not familiar with these SaaS metrics, I show below how I calculate each metric. There is a total of eight inputs required to calculate both metrics. These are not hard metrics to calculate, but some inputs such as CAC and Average Cost of Service require side calculations. Again, if you need more detail on these formulas, see the links above.
Customer Lifetime Value Formula (divide by CAC to get LTV/CAC)

CAC Payback Period Formula

Four Scenarios – from Bad to Great
I modeled four scenarios by changing the customer acquisition cost (CAC) to gauge the impact on the CAC payback period and LTV/CAC. I held the other inputs constant such as MRR, ACS, and inputs into the LTV formula (i.e. churn, WACC, etc.). If you would like to run other scenarios, please download my model below.
Downright Bad
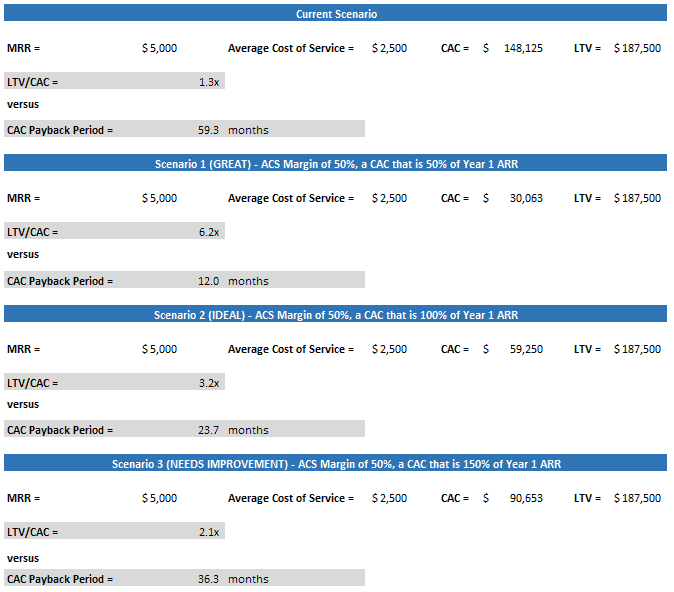
In the Current Scenario (see image below), I’m starting with a horrible CAC number. It’s well over 2x your ARR. You can see that this also manifests itself in each metric. LTV/CAC is well below 3x and your CAC Payback Period is five years. Ouch. In this case, both metrics tell the same picture. Bad unit economics.
Let’s Improve CAC
In scenarios one to three, I start with a fantastic CAC relative to ARR and then increase CAC in each scenario. At $60K ARR, you could say this is more of an enterprise situation. As I adjust CAC, let’s see what happens to the payback period and LTV/CAC. Do they paint the same picture?
Scenario 1 – CAC is great relative to ARR. Your LTV/CAC ratio and payback period are great. You could argue that a 12-month payback is just ok, but that is a function of assuming 50% margins (5K MRR – 2.5K ACS).
Metrics Aligned? Yes, both indicate good unit economics.
SaaS Takeaway…both metrics are positive. Want to improve your payback period? Focus on the costs that go into your average cost of service.
Scenario 2 – Your CAC is ideal relative to ARR for an enterprise business. Your LTV/CAC ratio is above the ideal 3x level but you might say that 24 months is too long for payback. Maybe, not horrible but getting up there.
Metrics Aligned? Mixed message. Your LTV/CAC is at 3X, but your payback period is getting a little long.
SaaS Takeaway…you are living on the edge. These metrics are not quite saying the same thing. Both are close but you need to dive into each input in the formulas above to see what needs to be improved in your operations.
Scenario 3 – Your CAC is not great relative to ARR. CAC is 1.5x your ARR and it shows in the two metrics. LTV/CAC is below 3x and your payback is much too long.
Metrics Aligned? Yes, bad unit economics.
SaaS Takeaway…you have too much capital tied up in CAC. You need to improve margins and watch out for churn. If churn increases, you’re going to have cash flow issues.
Conclusion
Both CAC Payback Period and the LTV/CAC ratio are SaaS metrics that you should be monitoring. From the simple sensitivity analysis above, I would suggest that these metrics indicate the same signal when you are in either a very good or very bad unit economic position.
If you are on the unit economic bubble, around 3x for LTV/CAC and longer payback periods, you will need to dive into each formula input to see what levers you can pull to improve your economics.
Bottom line…measure both. They each tell you something slightly different such that one metric does not carry more weight than the other.
To download the formula in Excel, please enter your valid email below (no spam) for the instant download. I’ll keep you updated on future SaaS Excel models.
If you do not receive the download, please contact me.
I have worked in finance and accounting for 25+ years. I’ve been a SaaS CFO for 9+ years and began my career in the FP&A function. I hold an active Tennessee CPA license and earned my undergraduate degree from the University of Colorado at Boulder and MBA from the University of Iowa. I offer coaching, fractional CFO services, and SaaS finance courses.


Your CAC Payback Period formula is ignoring churn, so it is understating the payback period.
For instance for a company with a CAC of $5,000, MRR of $500 your math states 10 month period (assuming ACS of ~0). When in reality, if you had a churn of 3%, the payback period is closer to 12 months (rounded up)
Hi Felix,
Great comment and insight. Yes, with CAC, you have to realize that this is a sunk cost. If you have churn or high churn, more and more of your cash flow is directed toward paying off CAC. This is where SaaS companies can get into cash trouble. You may think, hey, we have a great customer acquisition rate but behind the scenes, churn is making it hard to pay off those costs or extending the payback period.
Check out my other article on CAC where I specifically mention churn and dive deeper into the CAC payback period.
https://www.thesaascfo.com/cac-payback-period/
Ben