SaaS Financial Model
One of my most popular financials models, the SaaS Financial Model in Excel has been downloaded over 5,000 times. Whether you are starting a SaaS company or have millions in recurring revenue, my free SaaS model will help you create your first financial forecast or improve upon your existing forecast process.
There is so much more to understand than just your financial statements when running a SaaS business. Don’t get me wrong, though. If you are not forecasting now, having a good P&L forecast and cash balance forecast is an amazing start.
Keep reading below as I walk you through the major components of my SaaS financial model template.
The Excel Model can be downloaded below.
Recurring Revenue Model
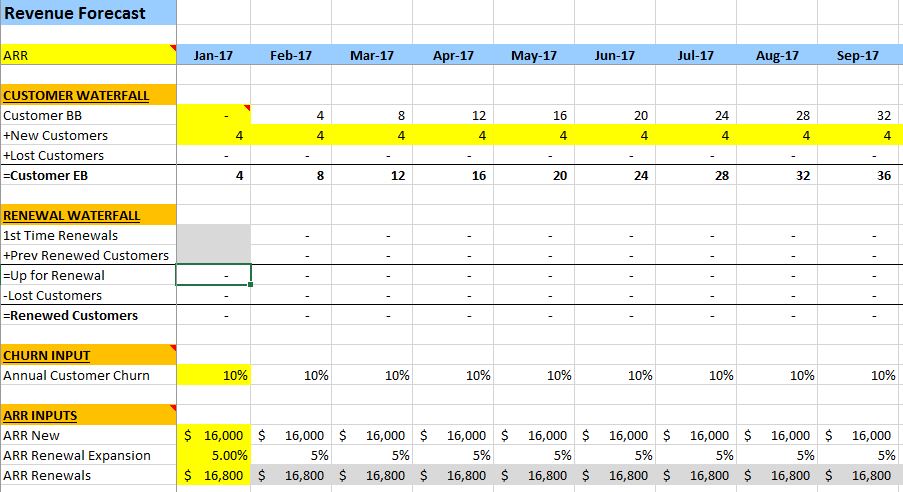
I have two tabs to forecast your recurring revenue. It includes common inputs such as new customer acquisition, customer churn, revenue expansion, related MRR/ARR revenue stats, and inputs to drive your professional services revenue. If you are an existing SaaS business, you can also enter your starting customer and MRR/ARR balances.
Headcount Forecast Model
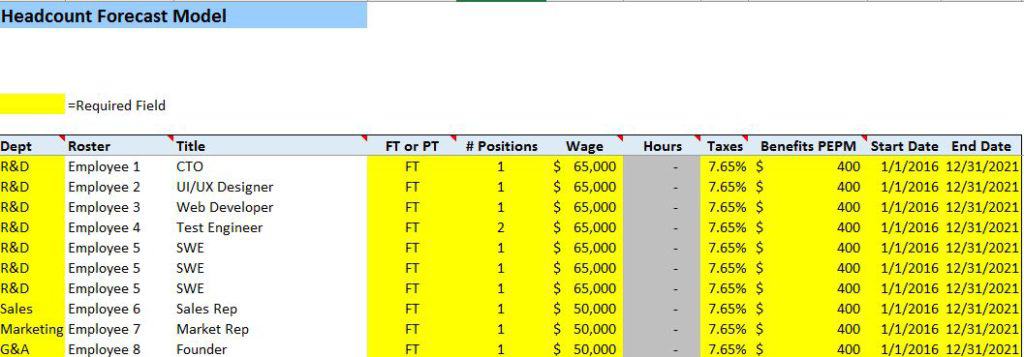
The next major tab is the headcount inputs tab. Here, you can input your current and expected headcount roster by position. You can add hourly or salaried positions and exact start and end dates. You can also include a benefits rate per position. To learn more about headcount forecasting, check out my detailed headcount forecast model post.
Operating Expense Model
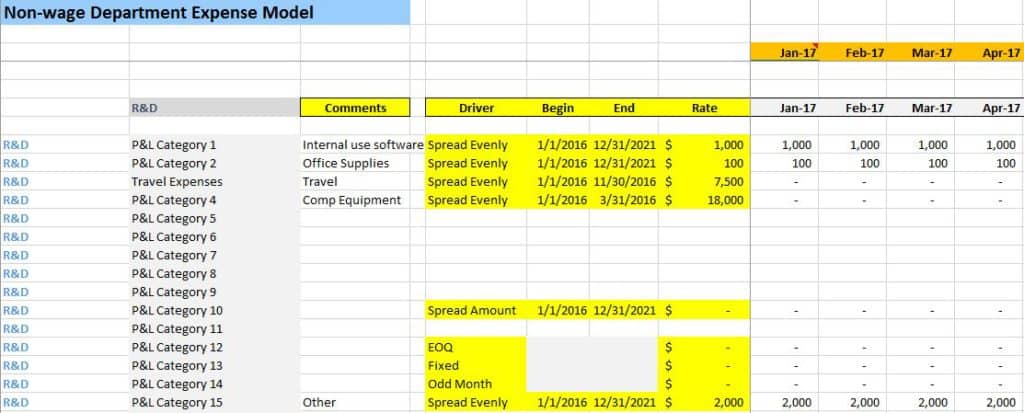
The last major input tab is the non-wage operating expense model tab. In this tab, you can forecast operating expenses at the department level. This is CRITICAL so that you can produce a proper SaaS P&L and the related SaaS metrics. I’ve included sample formulas that speed up your data entry so that you are not keying thousands of numbers manually into every month of the forecast.
SaaS P&L Template
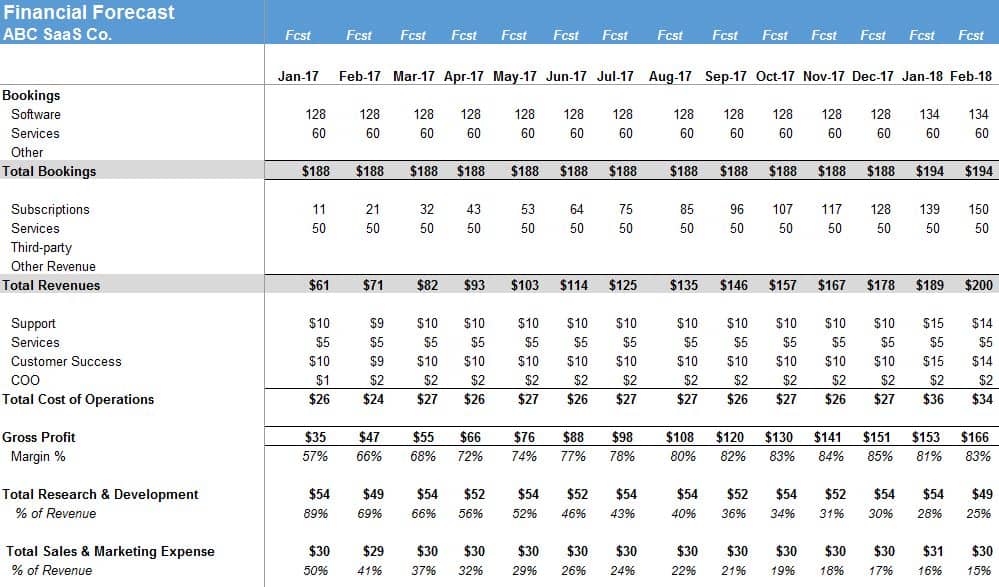
Once your inputs are complete, you can review your SaaS P&L summary. This is a standard SaaS income statement (aka P&L). It’s structured to produce a proper gross margin for your SaaS business. At the bottom of this page, I also calculate key financial and SaaS metrics for your business.
Summary
The model includes the following tabs to drive the forecast.
- Revenue Tab
- Inputs on customer counts, ARR, churn, etc.
- Headcount Tab
- Detailed model to forecast wages by position including start and end dates and benefits/taxes.
- Non-wage Tab
- Inputs by department to model non-headcount expenses. Includes formulas to help you easily spread expenses over specific time periods. I try to avoid hardcoding at all costs.
- CapEx Tab
- Input capital project details which will flow into the unlevered free cash flow section.
- Controls Tab
- Global controls tab for inputs such as model start date, tax rate, etc.
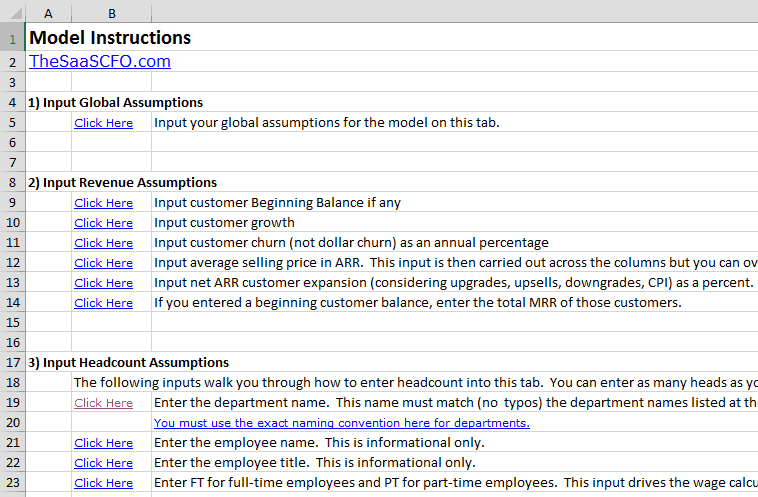
- Instructions Tab
- I have step-by-step instructions including links to each part of the model where you need to enter your assumptions. I will avoid boring you in this post with all of the how-to’s.
This SaaS Excel model is targeted to not only finance pros but also founders and SMB’s who need to forecast their SaaS business.
Feedback Please
Future features will include dedicated SaaS metric tabs, additional charts, SaaS benchmarks, and potentially a SaaS balance sheet and cash flow statement. I’d like to get your feedback on what is necessary to model your SaaS businesses or startups.
I would love to hear your feedback. What do you like and not like about the forecast model?
—>>For the latest version of my model, please see the SaaS Financial Plan page.<<—
Please enter your valid email below (no spam) to activate the download. I will keep you updated on future models.
[dlm_email_lock id=294]
If you do not receive the email, please contact me.
I have worked in finance and accounting for 25+ years. I’ve been a SaaS CFO for 9+ years and began my career in the FP&A function. I hold an active Tennessee CPA license and earned my undergraduate degree from the University of Colorado at Boulder and MBA from the University of Iowa. I offer coaching, fractional CFO services, and SaaS finance courses.
To answer a question that came in via email.
Question) In the summary you show Gross Profit as Revenue minus Cost of Operations (as normal). But the Cost of Operations (Cost of Sales/Cost of Revenue) does not take into account the “Cost of Revenue” as shown in the Non Wage inputs tab (line 42). I believe this is because the P&L Category 1 is designated as Cost of Revenue but is used as an item under Marketing Department – and therefore these costs show up as Marketing in the Summary tab. I believe that if you want to show the Exps by Category and also enter the expenses by Department then you have to ensure that P&L Category that is designated as Cost of Revenue must not be used in Departments which are not linked to Cost of Revenue ?
Answer) Great observation and one that I should explain more in the post. The Summary by P&L Category on the Non-wage Tab is informational and not used to pull data to the Summary Tab except when needing certain expenses (i.e depreciation) for the cash flow. It is an alternative way to roll up your expenses that are inputted at the department level below.
The inputs in cells A10 to A38 on the Non-wage Input Tab are used to categorize major expenses. These could be adjusted as well to your suiting. In this case, I was inputting sample data to get data into the model and didn’t notice the mismatch (i.e. marketing is not a Cost of Revenue).
I can see that it would be a bit confusing. The Summary tab pulls department data from the Non-wage Input Tab from The Summary by Department (cell B46).
[…] over 600 downloads, the SaaS Financial Model was by far the most popular download. No surprise as this gets you started with forecasting your […]
Hi.
Thanks for the article! Unfortunately it hard to read on Ipad/chrome because the social share bar on the left side overlaps the first few letters and n each row.
Hi Arpi,
Thanks for letting me know. I changed it to the right side.
Ben
Hi Ben,
I am trying to use this xls to model a PMV startup and have some questions and don’t understand the relationship between some of the formulas/cells/sheets. Is there an email I can dm?
Anthony
Yes, I sent an email directly to you or contact me via the contact form. https://www.thesaascfo.com/contact/
What if your SaaS offering has multiple products? How do you account for the different calcs for each and then summarize?
John,
If you have multiple products, you could use the revenue/bookings/churn characteristics specific to those products, but then any expense related data required for the calculation would most likely be the aggregate of your expenses and not product specific. Unless your are a large company and have departments dedicated to specific products.
Ben
Does the saaS model support a both a “subscription” revenue stream and a “consumption” revenue stream that is based on a model that aligns 1 – subscriber to many individuals that will have variable usage ?
Hi Greg,
Yes, but you would need to modify the the revenue models a bit to accommodate usage-based revenue projections.
Ben