Your professional services team plays an important role in your SaaS company. Botch a customer onboarding and you may have just lost valuable ARR.
Services means different things to different companies. It could be a one-hour onboarding call or a twelve-month implementation project.
Either way, we must understand several key concepts to effectively manage our services team, make customers happy, and make our ARR sticky. I like to manage our professional services team like its own business unit.
With the professional services function, we must understand services backlog, backlog in months, billable utilization, and services margins. I’ll dive into each topic in this post.
What is Professional Services in SaaS?
Professional services in SaaS refers to the setup, configuration, onboarding, and training of customers on our software. This can range from very light onboarding to months of onboarding and training for our customers. It’s often dependent on the complexity of our product.
Services are typically offered to help our customers implement, customize, and optimize our SaaS solution according to their specific needs and requirements. Professional service is often referred to as implementation services.
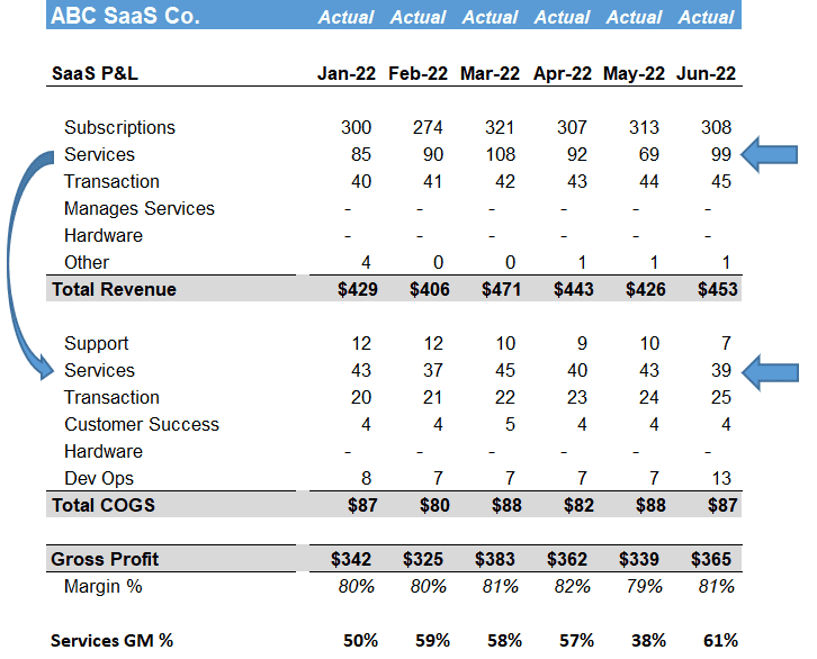
We may charge our customers for the onboarding, or we may offer it for free if it’s a simple and quick onboarding. Whether you charge for services work or not, I recommend that you capture the cost of professional services in the COGS section of your SaaS P&L.
There are several important financial concepts with professional services. These include:
- Services backlog
- Backlog in months
- Billable utilization
- Services margins
Professional services in SaaS attempts to ensure the successful implementation of our customers. Although we are trying to maximize ARR in our business, we know that services are critical for the successful relationship with our customers.
What is Professional Services Backlog?
Professional services backlog refers to your contracted services revenue that has been booked but not delivered and invoiced. One nuance here. It can be invoiced and deferred, but it still needs to recognized to revenue. Let’s break down the details.
When we have a PS function, services revenue is booked in a customer contract when our customer signs up for our software product. Services revenue is typically along for ride when customers initially purchase your software or buy additional software (expansion deal). We refer to this as an attachment rate.

Backlog represents the outstanding services work in dollars (or your currency) that needs to be completed. It could represent customer training, the configuration of our product for the customer’s needs, and so on.
There is a constant balancing act between managing your backlog levels, meeting client project demands, and your staffing levels. We don’t want to get stuck in a position where new customers must wait a long time to kick off their project.
Delays in services delivery can lead to upset customers and potentially lost ARR. Growing backlog balances can strain existing staff and hinder productivity. Again, it’s a constant balancing act.
Professional Services Backlog Example
Let’s walk through a services example. Let’s say we signed the following contract with a customer.
- Three-year software contract
- ARR invoiced annually
- ARR of $50K and total contract value (TCV) of $150K
- $50K of professional services – fixed fee
When we execute this deal, our professional services team just landed $50K of services backlog. In this example, it’s a fixed fee services contract. We essentially guaranteed a scope of work and the dollars that the customer will pay for their software implementation.
As we invoice the customer, this reduces our services backlog. Invoicing could be milestone-based invoicing. For example, project kick off. Or it could be percent complete invoicing. Regardless of invoicing terms, as we invoice, this reduces our backlog.
If we invoice the customer for $10K of the $50K, we now have backlog of $40K for this specific customer. We “pulled through” $10K of services backlog.
Be sure to coordinate with your accounting team on standard invoicing terms and how revenue recognition is affected by how you write your services contract.
Of course, we are managing backlog at scale, so you might have twenty active services projects totaling $1M in service backlog. We must track backlog in total and by project. I monitored this every month during my close process. If we had not invoiced a project in while or missed a milestone date, I’d follow up with my services leader.
Backlog is also a “point-in-time” number. It must be updated every month.
What is Professional Services Utilization?
Like peanut butter and jelly, we can’t talk about backlog without addressing utilization. Utilization is a services metric that measures the percentage of available hours that our services staff dedicate to customer projects.

We track both billable hours and non-billable hours. Billable hours are the numerator in the utilization equation. The denominator can be tricky. Available hours represent the theoretical capacity of a billable staff. It’s NOT 2,080 hours, or a full-time equivalent (FTE).

Typically, we reduce 2,080 by training time, internal time, events, an allowance for time off, and so on. However, we want an available hours number that is a stretch goal but does not burn out our services team.
In my experience, we target utilization rates between 70% and 80%. Below that, we have additional capacity to take on projects. Above that threshold, we could be burning out our valuable services staff. Billable utilization, of course, correlates with our services margin.
In the $50K services project example above, we will have an implied billable rate for this project. From experience, we know how many hours it will take to implement the average customer or standard scopes. $50K divided by the estimated project hours equals our implied billable rate. It’s another good metric to measure.
By analyzing data on utilization rates and backlog levels, SaaS businesses can make informed decisions about staffing, project prioritization, and resource allocation.
Calculating Services Backlog in Months
Do you know your services backlog in months? It’s another critical metric to determine the balance between backlog and staffing.
Backlog in months is the number of months your team would need to pull all services backlog into revenue. This is a single point-in-time metric based on current staffing and backlog. You should calculate and monitor this metric every month.

Backlog in months is calculated by dividing current monthly burn capacity into current backlog. Current monthly burn capacity is the amount of revenue that your current billable team can pull from backlog to revenue. I calculate this based on historical averages.

Hiring Services Staff Based on Backlog Levels
Determining when to hire additional professional services staff depends on several factors, including your current services backlog, utilization rates, and backlog in months. When your backlog in months continues to rise, it may be an indication that it’s time to hire more billable staff.
It’s important not to hire based solely on backlog levels. Hiring too many billable staff without sufficient work can lead to lower services margins and put a strain on cash.
However, we must consider current utilization rates and forecasted services pipeline. If the pipeline is not replacing your backlog burn each month, there probably is not a need to hire additional staff.
As a CFO, justifying services hires is one of the easiest cases to make. We can justify hiring plans based on current backlog, forecasted backlog, utilization rates, and backlog in months.
Professional Services Margins
I manage services teams like they are independent business units. Services revenue offset services expenses. If you have material onboarding efforts, it’s important to monetize this effectively.
If you don’t charge for services revenue or undercharge, it can strain your cash flow as your company scales and requires more services staff. Often, I see early-stage SaaS companies supplement their cashflow with high services margins. But we must wean off this services margin “addiction” at some point.
Generally, I target 15% to 25% services margins as healthy margins. If you can achieve higher margins, even better. However, we don’t want charge so much for services that it puts pressure on ARR discounts.

Service Margin Benchmarks
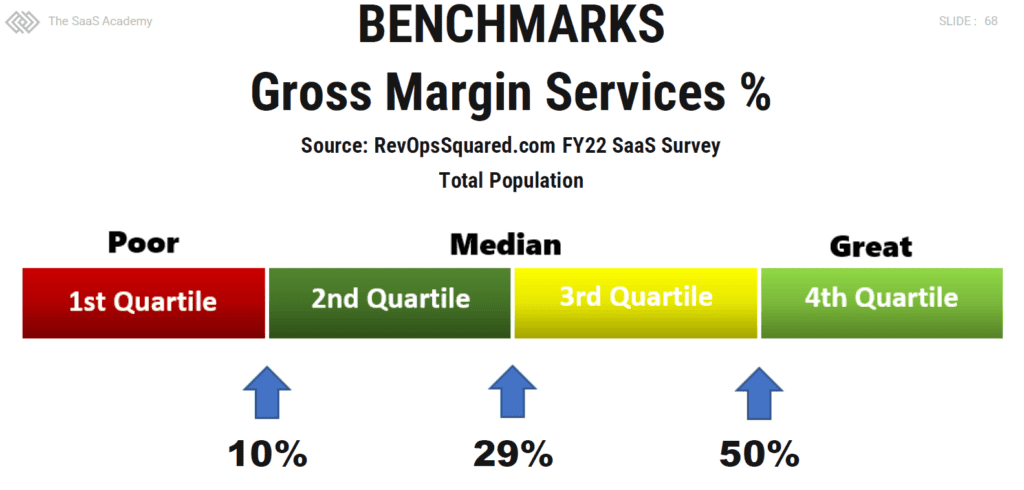
When I need SaaS metrics benchmarks (which is all the time!), I head over to Benchmarkit.AI. Let’s look at services margin benchmarks.
Your targeted services margin can be a bit subjective. I don’t recommend breakeven or negative margins. But this median margin below is a nice, healthy margin. You could even be a bit lower and be fine.

Action Items
If you have a services team or onboarding team, it’s important to quantify the performance of this team. Services metrics help you effectively manage current project demands, future demands, and effectively hire billable staff.
Calculate the following metrics for your services team:
- Services backlog
- Billable utilization
- Backlog in months
- Implied billable rate Services margin
Please comment below with any questions and if you monitor additional services metrics!
I have worked in finance and accounting for 25+ years. I’ve been a SaaS CFO for 9+ years and began my career in the FP&A function. I hold an active Tennessee CPA license and earned my undergraduate degree from the University of Colorado at Boulder and MBA from the University of Iowa. I offer coaching, fractional CFO services, and SaaS finance courses.
