Excel Waterfall Chart
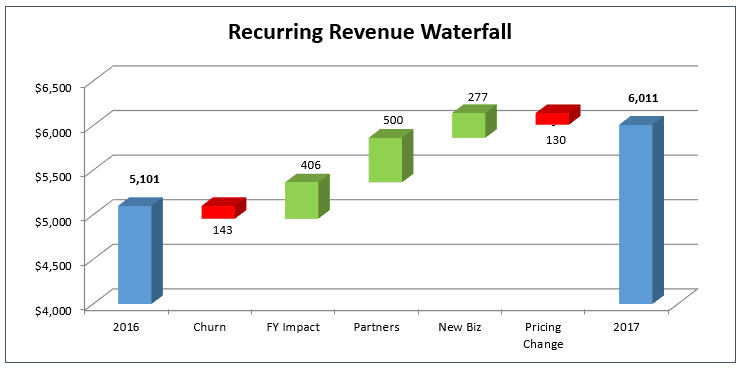
Somewhere along the line, we’ve all been asked to create an Excel waterfall chart for a Board or management presentation. Waterfall charts are a very “simple” and powerful visual method to present year-over-year changes or whatever time period you are measuring. Presenting variances via a bunch of numbers on a spreadsheet can fail fast if you are not talking to other spreadsheet jockeys.

I am not going to take you step-by-step through my process to build a waterfall chart in Excel but cut straight to the chase and have you download the Excel template below. It is set up with two examples, so that you can modify for your own needs.
Please post your questions and comments below and especially if you have a better way to create Excel waterfall charts for free.
Download below.
Please enter your email address (no spam) below to download the model. I’ll keep you updated on future models and posts.
I have worked in finance and accounting for 25+ years. I’ve been a SaaS CFO for 9+ years and began my career in the FP&A function. I hold an active Tennessee CPA license and earned my undergraduate degree from the University of Colorado at Boulder and MBA from the University of Iowa. I offer coaching, fractional CFO services, and SaaS finance courses.
