When I review a SaaS P&L for the first time, I take a high-level approach to understand the financial health of the business. I break the P&L into two sections, the “top half” and the “bottom half.”
The top half contains revenue, COGS departments and our gross profit. The bottom half contains our operating expenses (OpEx). Revenue and margins receive a lot of attention, but it’s just as important to understand the economics of our operating expenses.
Operating expenses are the expenses below gross profit that support the infrastructure, growth, and continued development of our business model.
We must understand how our operating expenses move with revenue. Do we have the necessary amount of investment to support the growth and stability of our business? Will we create operating leverage over time?
In this post, I sliced and diced data from the Latka 1000 list. This analysis provides great benchmark data and interesting insights into the OpEx profile of SaaS businesses as they scale.
Your OpEx Profile
In SaaS, operating expense departments include R&D, sales, marketing, and G&A (HR, IT, finance, accounting, legal). Whenever I read a set of historical or forecasted financials, I like to calculate the department’s expense as a percent of revenue.
As a percent of revenue, you can understand the investment the organization is making into the department. You can also benchmark that percentage against your SaaS peers.
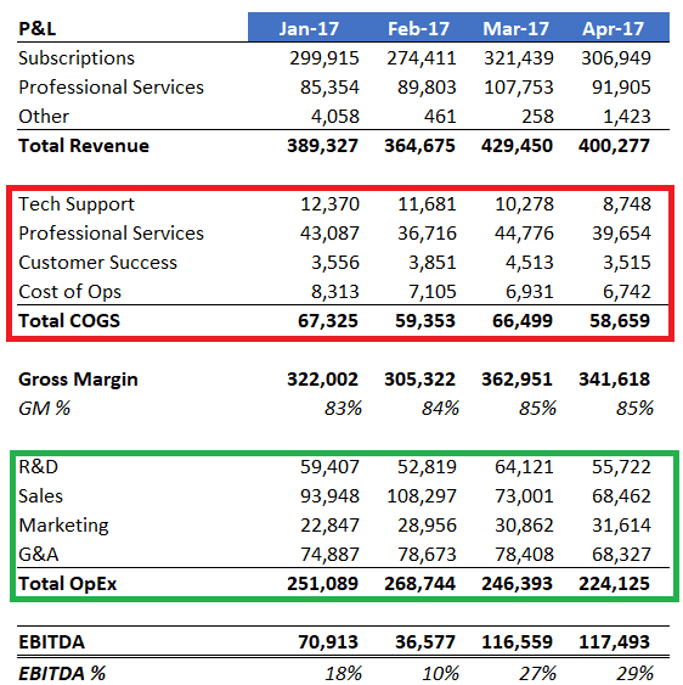
Just like revenue and bookings targets, we must also have targets in mind for our OpEx profile. I’m a proponent of doing this for R&D and G&A. However, sales and marketing as a percent of revenue does not tell me much. With sales and marketing, I’ll refer to the related SaaS metrics to understand the investment and efficiency in our sales cycle.
HubSpot’s OpEx Profile
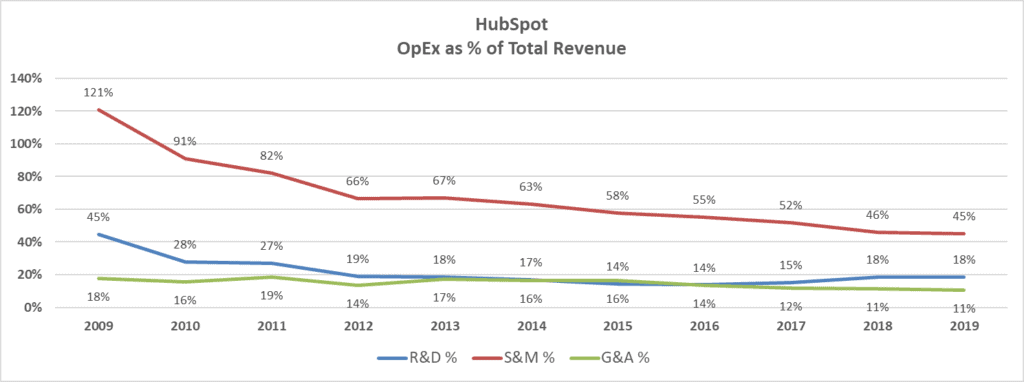
To see an OpEx profile in action, check out Hubspot’s profile from pre-IPO to post-IPO. In the early days, you can see a lot of investment in sales/marketing and R&D as a % of revenue. G&A was actually in good shape. Often you see G&A around 30% in the early days.
As Hubspot scaled, it became more efficient as a percent of revenue over time. You should run this same exercise for your SaaS business. What direction are your percentages moving?
OpEx Headcount Benchmarks
There are a lot of public company data available to benchmark our OpEx profile, but rarely do we have actual headcount numbers to benchmark, let alone for private companies.
With Nathan Latka’s permission, I analyzed the headcount data found in his Latka 1000 list. I segmented the data by revenue size and investment stage. The charts below provide great insight for founders and finance into the number of sales, marketing, and R&D (engineering) staff by company stage.
I also analyzed funding to revenue, revenue per FTE, and total headcount by stage.
Total Funding to Total Revenue
In all of the charts below, I segmented the data by company revenue size and investment stage. It’s always interesting to see how the data changes as companies scale.
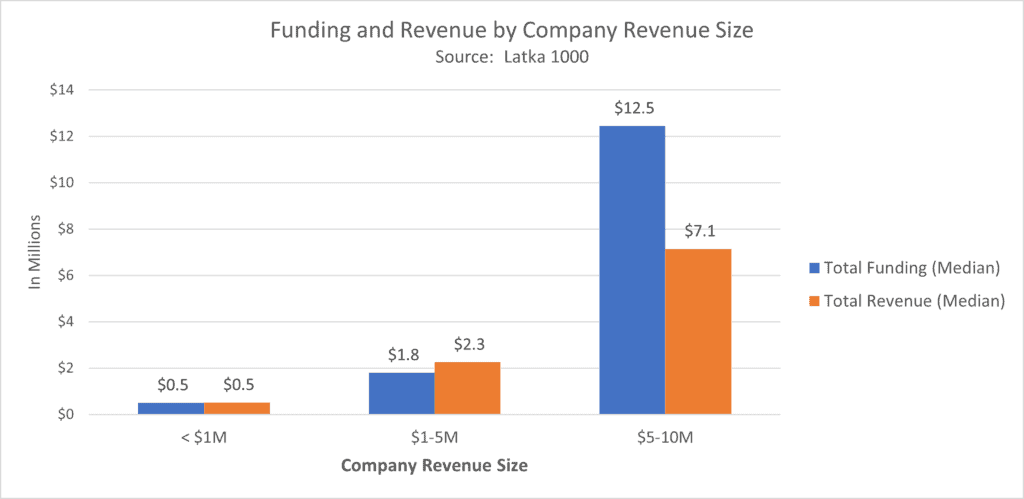
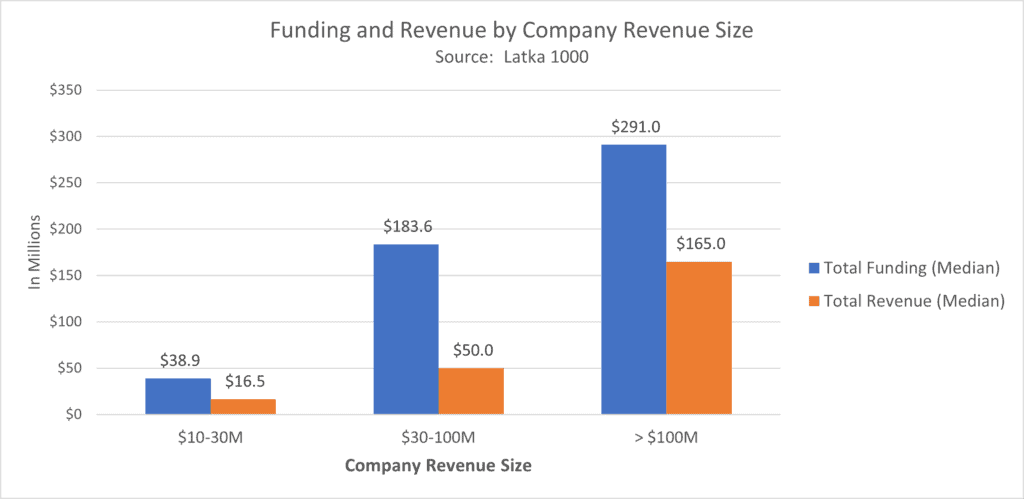
In the four charts below, I compare total funding (median) to total revenue (median). Funding to revenue or ARR is often used to determine invested capital efficiency.
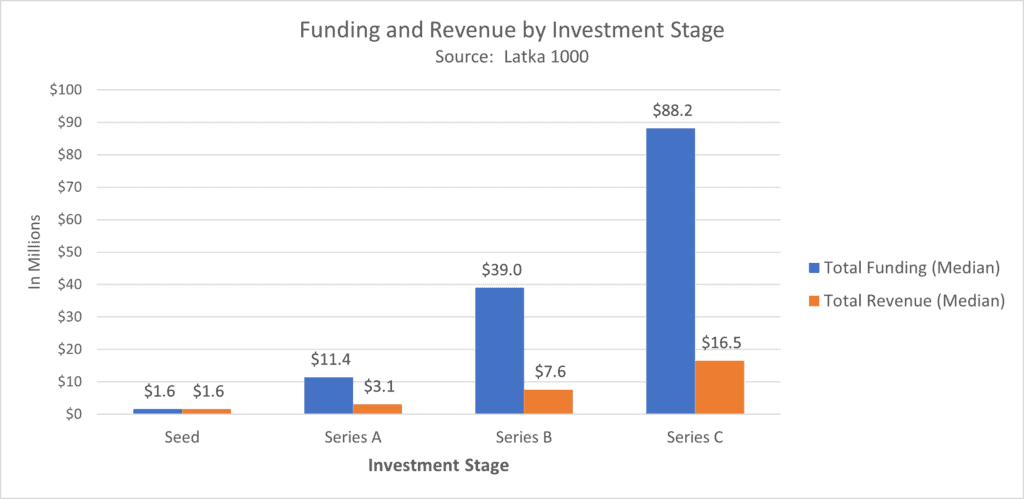
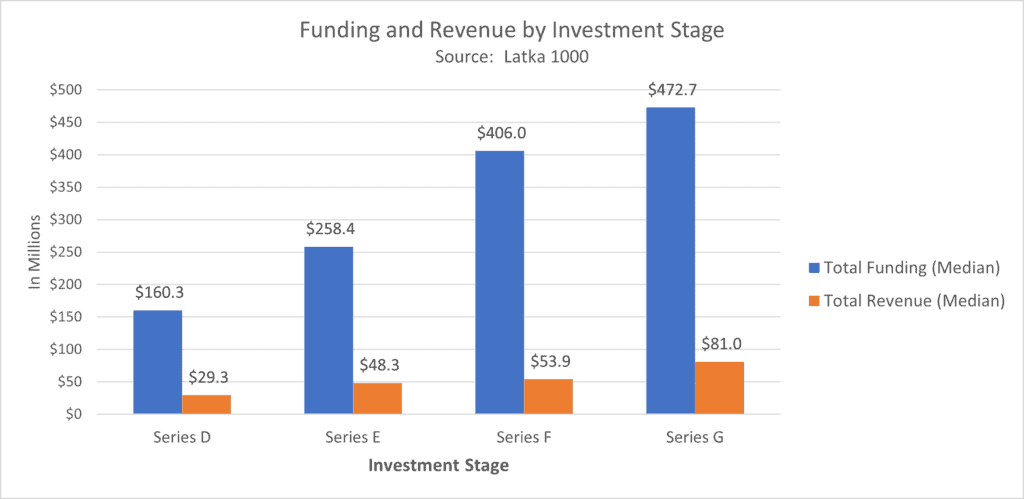
Funding to Revenue Ratio
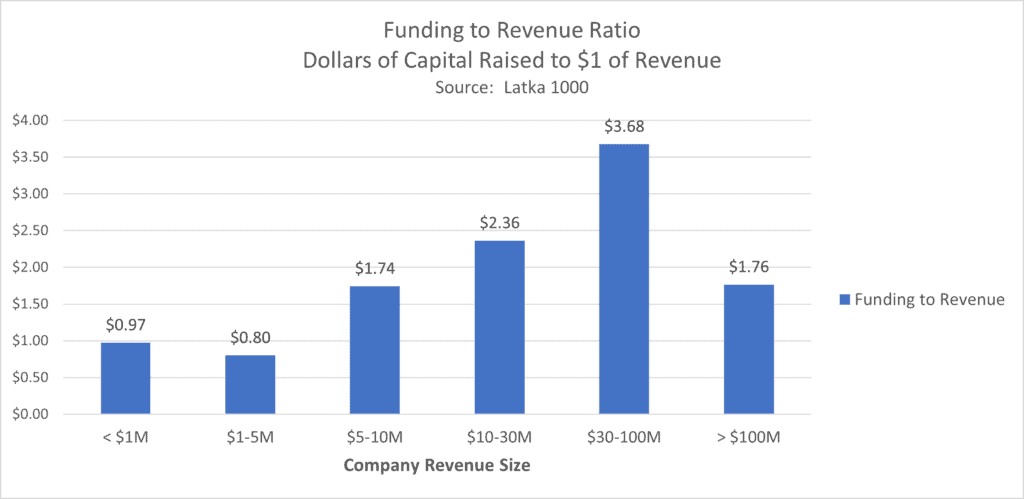
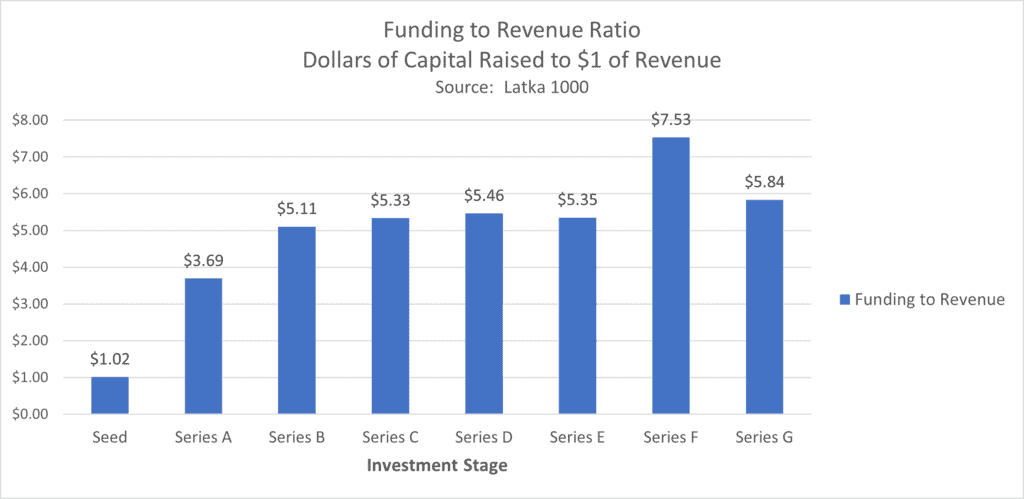
The funding to revenue ratio uses the same data as in the charts above. I’m dividing total funding by total revenue. This is similar to the SaaS CAC Ratio where we calculate the amount of sales and marketing dollars to generate a dollar of new ARR.
In this case, I am calculating how much capital was required to generate a dollar of revenue to get to that revenue stage or investment stage. Again, the focus of this metric is on capital efficiency and cash-on-cash returns for investors.
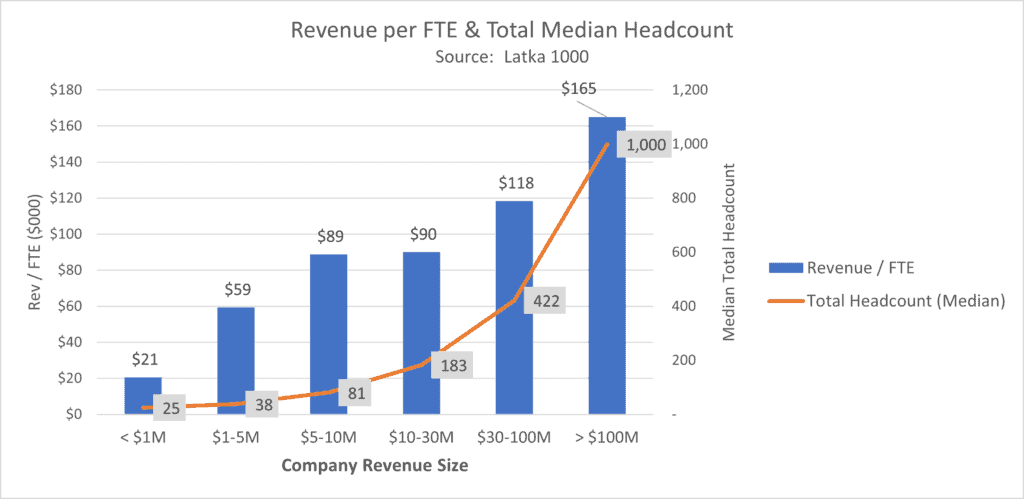
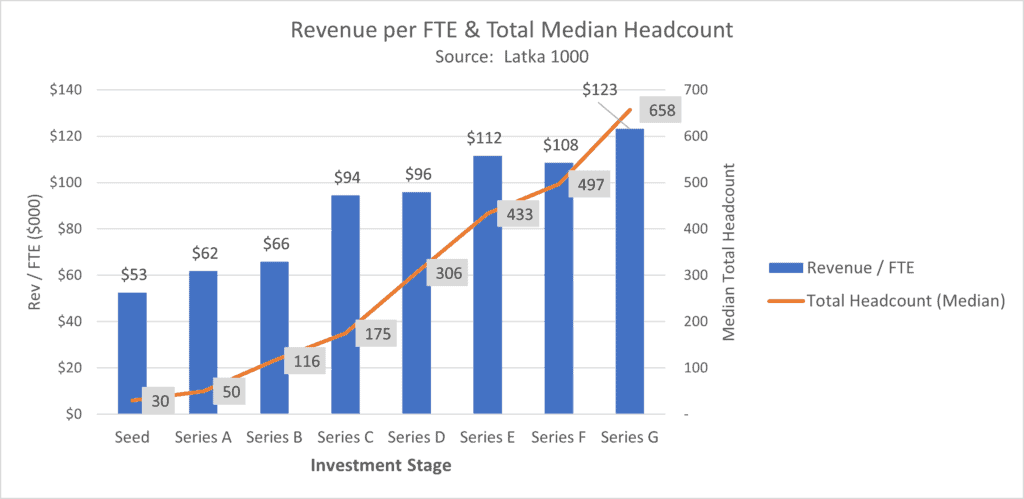
Revenue per FTE and Total Headcount
Revenue per FTE is an often used metric of organizational efficiency. Check out my ROSE metric for a more accurate version of this metric. You see efficiency improve as revenue grows in the charts below.
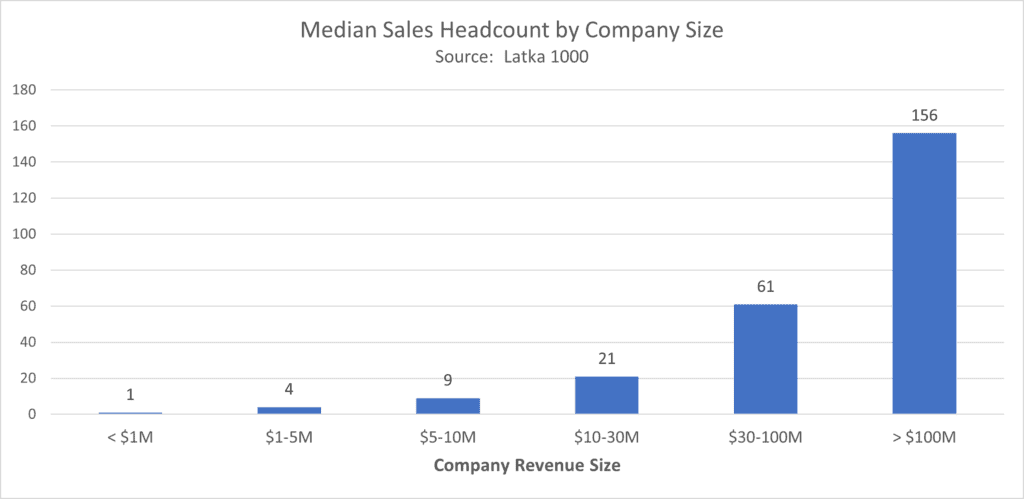
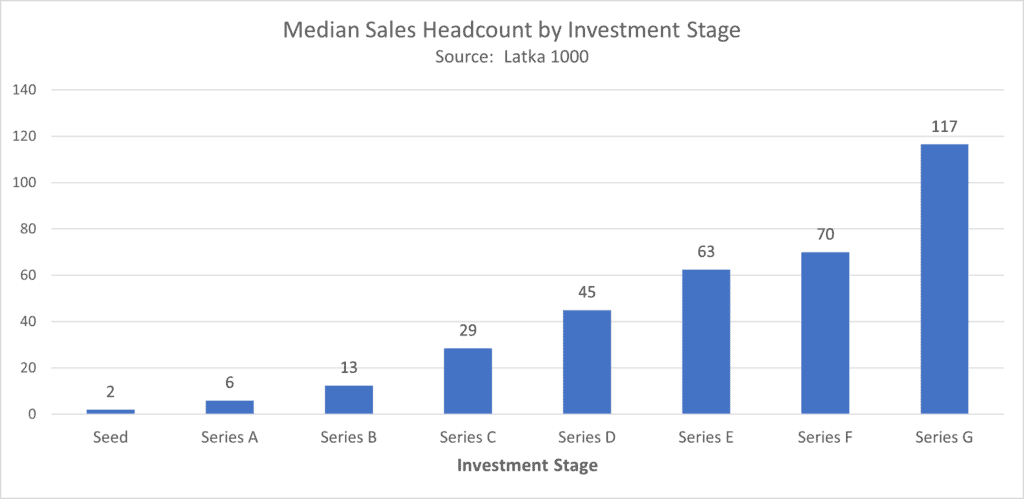
Median Sales Headcount
The following headcount charts are great references to benchmark your SaaS company. It’s always interesting to see the size of your peer’s departments and compare them against your own.
I’m using median values so there may be some plus/minus on these numbers.
Median Marketing Headcount
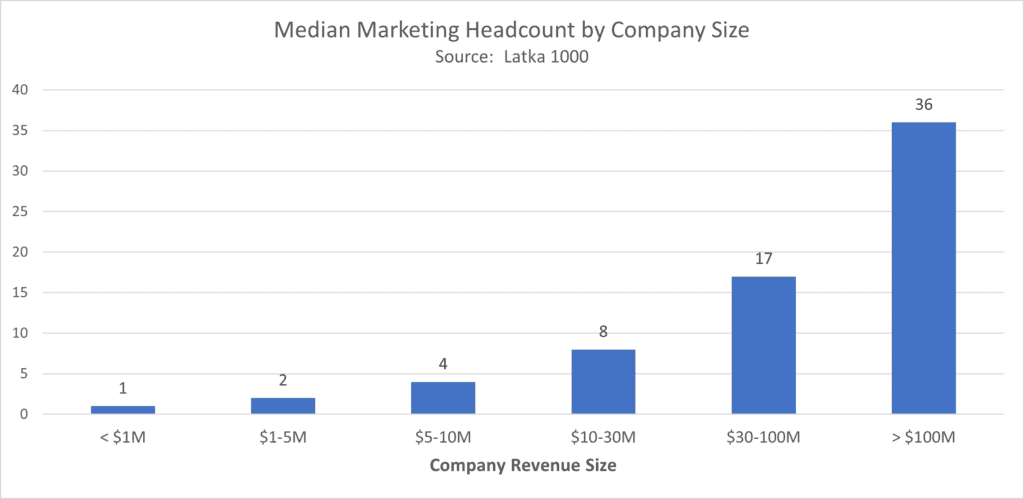
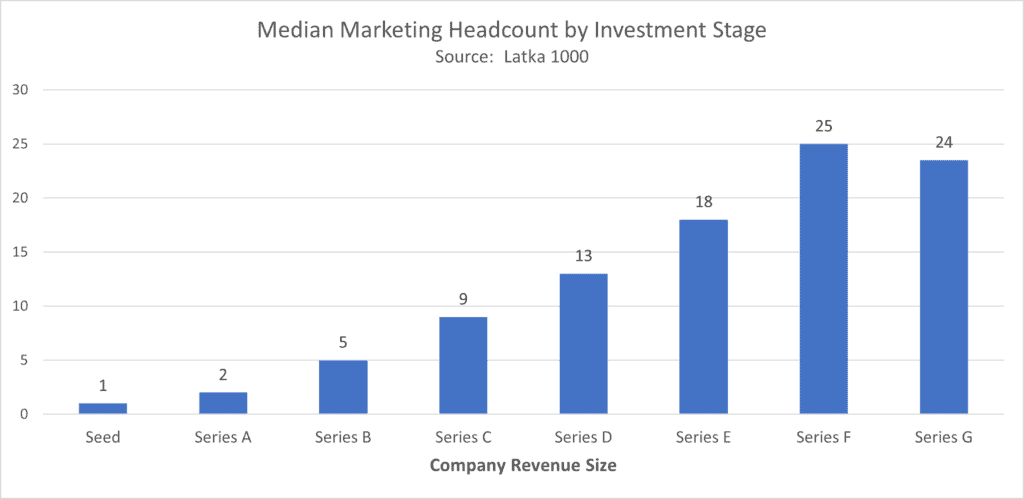
Median Engineering Headcount
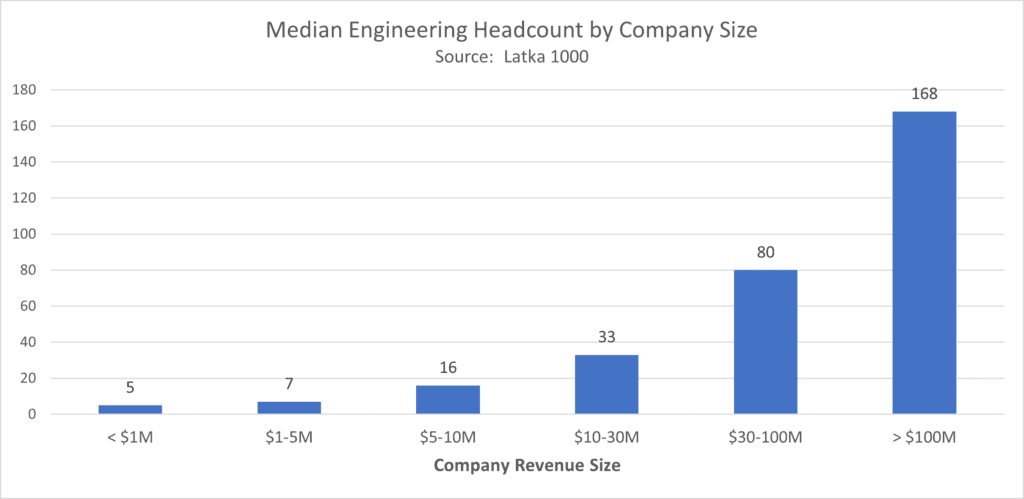
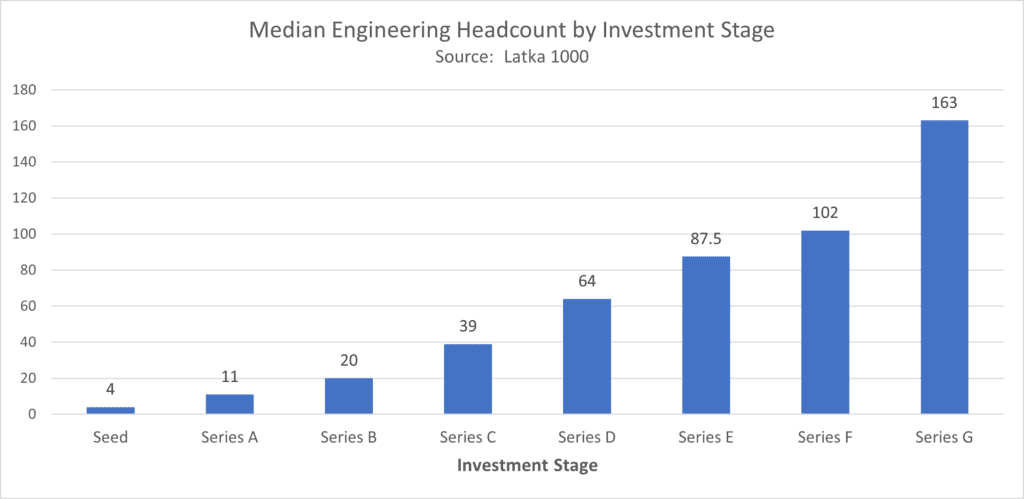
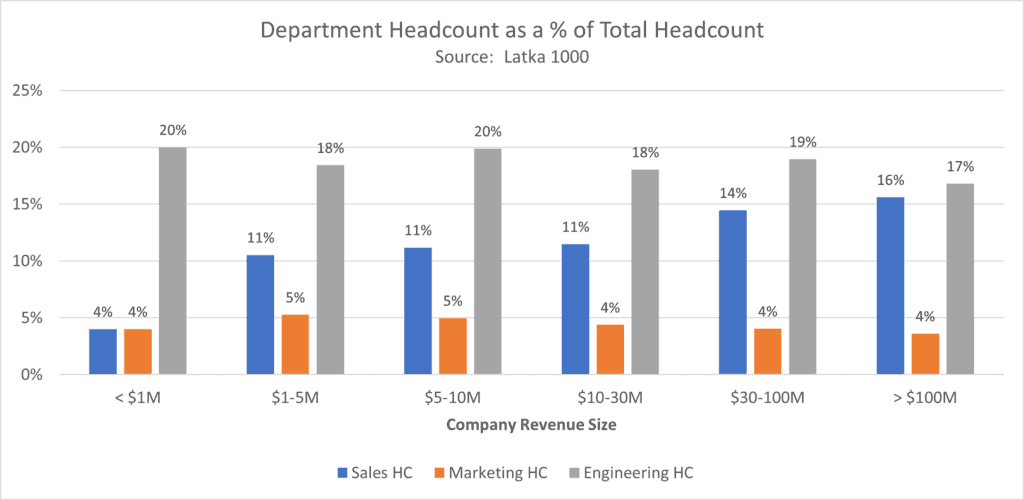
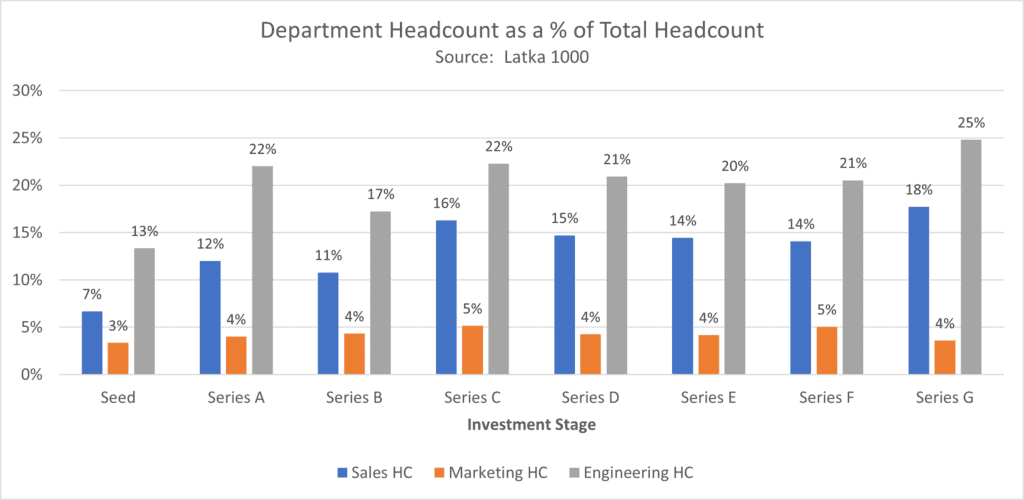
Department Headcount as a % of Total Headcount
When I calculated the numbers below, I was shocked at the consistency across company revenue size. Yes, there is a little variation but that makes sense.
Sales headcount as a percent of total headcount slowly increases as revenue increases. This is understandable. Harder to grow when you are a big company. On the engineering headcount, I would expect increased efficiency over time. Same with G&A (not pictured).
I have worked in finance and accounting for 25+ years. I’ve been a SaaS CFO for 9+ years and began my career in the FP&A function. I hold an active Tennessee CPA license and earned my undergraduate degree from the University of Colorado at Boulder and MBA from the University of Iowa. I offer coaching, fractional CFO services, and SaaS finance courses.
