Average Cost of Service (ACS) is an important but obscure SaaS metric for SaaS finance. I reference this metric when speaking with SaaS founders and finance teams about the balance between their cost structure and pricing plans. It’s also a component of my SaaS Scalability Index (SSI).
Average cost of service helps us determine if we have revenue and/or cost structure imbalances. It also helps when reviewing our sales discounting policies and introducing new pricing plans.
In this post, I’ll explain the components of ACS and how you can calculate this SaaS metric for your business.
Excel template can be downloaded below
What is Average Cost of Service (ACS)?
Average cost of service focuses on your existing cost structure. It attempts to identify the expenses associated with supporting existing customers.
Of course, this can be a bit fuzzy depending on the department. We do not want to include any expenses associated with generating new business.
Once we identify the expenses associated with our existing customer cost structure, we then break this down into a unit cost per customer or user.
The result is the average cost to support one customer. We are focused on the on-going expenses and related cost structure to support our customers.
Average Cost of Service Expenses
The ACS metric requires a deep understanding of the function and roles within each department in our SaaS business. A properly formatted SaaS P&L makes the mapping exercise easier.
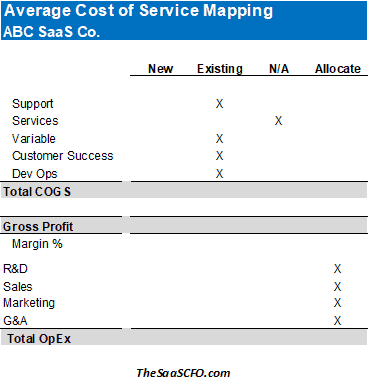
Below I identified the departments that directly support our existing customers, the departments that we must allocate, and the departments that are not relevant.
In general, COGS supports our existing customers and our obligation to deliver on revenue. I excluded services (onboarding, training, configuration) as that is one-time in nature.
Below gross profit, our OpEx departments support both existing customers and existing customers. We must allocate the expenses in these departments to isolate expenses supporting our existing customers.

Here’s the general logic that follow to allocate OpEx between new and existing.
Operating Expenses:
- R&D – we need to talk to our R&D leader to determine the time spent on bug fixes, platform maintenance, and technical debt. We exclude new feature development and experimentation.
- Sales – we should focus on the team/roles supporting our existing customer base. Typically, our account management team. If we calculate our New Cost of ARR, we take ( 1 – New ARR Focus %) to get this percentage.
- Marketing – the portion focused on existing customers. If you calculate your New Cost of ARR, then you take ( 1 – New ARR Focus % ).
- G&A – an estimate of your back office time to support existing customers.
To think about it in a different way, if we stopped acquiring new logo business, what resources would be required to maintain our existing customers. I do admit that including our account management might be debatable. They generate incremental revenue for our business.
How to Calculate Average Cost of Service
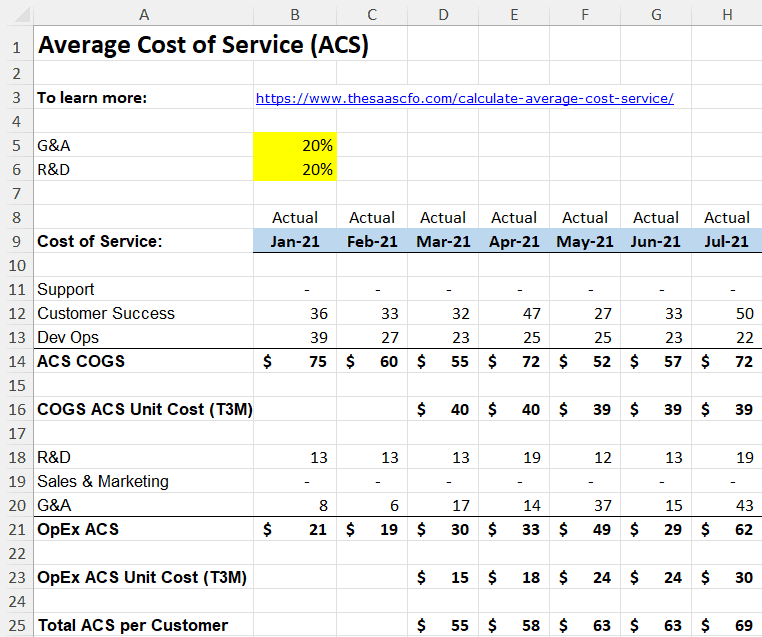
Based on the criteria above, we start with our SaaS P&L. We feed the department expenses and allocated department expenses into an ACS formula.

I cut it two ways. First, ACS based on COGS. Second, ACS based on OpEx. Finally, ACS combined. ACS in the OpEx area can get fuzzy, so it’s important to understand how OpEx contributes to your total ACS.
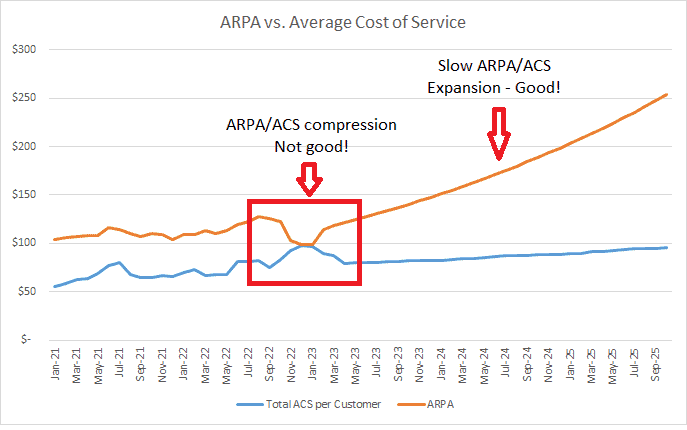
The chart below demonstrates the importance of average cost of service. If our cost structure is out alignment or we have not figured out our pricing or we have heavy discounting, we could see ARPA (average revenue per account) and ACS compression. It will be difficult to scale our business without economies of scale and/or fixing our pricing.
This exercise also helps when working with our sales team on appropriate pricing levels. Sometimes, you see a new deal where the net price falls below our ACS. We will never make money on that deal.
Ideally, we see ARPA and ACS expansion over time as we scale and become more efficient in supporting our customer base.

SaaS Economies of Scale
Understanding the spread between ARPA, new deal pricing, and ACS is critical. To successfully scale your SaaS business, you must understand these unit economics.
If you serve enterprise customers, for example, and now want to offer an SMB plan (lower price point), how does impact your delivery of revenue and resources required?
Or maybe you still land enterprise customers but are experiment with more affordable pricing entry points. Do you have any ARPA/ACS spread or will you have to make it in volume over time to lower your unit cost structure?
Will adding 100 customers drive down your unit costs significantly? Or will it take 1,000 customers? Calculating economies of scale helps me answer these questions and educate the leadership team about our cost structure and the impact of customer growth on our unit costs.
Please post your comments or questions below. I would love your feedback in this area.
Please enter your email address (no spam) below to download the model. I’ll keep you updated on future models and posts.
I have worked in finance and accounting for 25+ years. I’ve been a SaaS CFO for 9+ years and began my career in the FP&A function. I hold an active Tennessee CPA license and earned my undergraduate degree from the University of Colorado at Boulder and MBA from the University of Iowa. I offer coaching, fractional CFO services, and SaaS finance courses.

Hi Ben,
Practically speaking, how do you differentiate your software CAPEX in order to exclude it from your total development cost center expenses? What exactly are you cointing in there? (Theoretically your approach seems absolutely right, by all means.)
Thanks for the nice spreadsheet.
Regards,
Kalin
Hi Kalin,
Thanks for the great question. When I credit the P&L for software capitalization, I credit the R&D cost center (department). So when you sum R&D’s total expenses, it nets out the software CapEx (i.e. new development). My chart of accounts is structured so that I have cost centers or departments for the major areas of the business (sales, R&D, support, etc.).
Regards,
Ben
Regarding this post, I received some great questions which I wanted to share with all.
Question – Do you consider your Cost of Service as being the same as your Cost of Revenue (Cost of Sales) in your internal management accounts or do you consider them different metrics? For example, I would normally consider Account Management costs to be Sales & Marketing related and not include it in the calculation of my Cost of Revenue. If Cost of Service is different it would mean that your Revenue less your Cost of Service (ie Customer Contribution Margin) is then different from Gross Margin (Revenue less Cost > of Revenue/Sales). Would this cause any confusion with Management?
Answer – I consider Cost of Service (SaaS measure) different from your traditional COGS/Cost of Sales. Although there might be some overlap, Account Management would traditionally be below the gross margin line on a software P&L, for example. So I have internal reports that show a traditional P&L but when I talk about cost of service to management, it is usually in unit economic terms, not in gross dollars such as a new P&L with a cost of service line. But I agree, two P&L’s would cause some confusion if shown this way.
Question – Your model assumes a linear development of costs. In reality, however, the Fixed Costs are not likely to stay “fixed” with different levels of customers, ie the Admin costs required for a business with 2,000 customers is likely to be different from the Admin costs for a business with 100 customers. I would argue the same for ACS also. For example, your Support and Hosting costs are likely to be different for a 1000 customer business than when you grow to 3000 customers and not likely (hopefully) to be three times as much. If it were, then it means you are not, in fact, getting any efficiencies with volume. I know that you cannot build this “automatically” into a model like this but I think one needs to be careful with the interpretation.
Answer – Yes, I agree with your fixed cost statement. All fixed costs are variable in the long run. I think this is more of an “economics” lesson to show what it would take to move significantly down the curve. In reality the curve would be moving as well b/c some fixed costs would be increasing. A takeaway lesson for me is the impact of your fixed costs on your overall cost structure and do you have some imbalance in how much fixed costs it takes to serve the company and external customers.
[…] Model in Excel. Over the past few months I have released various Excel models covering forecasting, SaaS metrics, and personnel expenses. I combined some of these models into one and developed version one of my […]
[…] or SaaS metrics such as average revenue per account (ARPA), customer acquisition costs (CAC), and average cost of service (ACS) to name a […]
[…] None of this incremental revenue is covering your cost of service or cost of operations. Therefore, you need another year to reach a revenue level that covers both your S&M and your cost of service. […]
[…] ACS = average cost of service […]
Hi Ben,
What is the business rationale for including R&D amortization costs in ACS? Is it because your customers expect periodic upgrades / new features to an existing product? – In your opinion would it be appropriate to bifurcate capitalized upgrades to existing products vs development of new products (i.e., maintenance vs growth capex).
Thanks
Rich
Hi Richard,
Including R&D amortization in ACS covers the economic cost of the product that users are consuming each month. Yes, it’s common for the R&D team to have 4-5 buckets of how they spend their product time.
Ben
Great article. I did have a few questions:
1. Why are you calling it average COS/customer? Assuming the recurring customers per month increased (growth) or decreased (churn), your average COS/customer would be the average of the total cos/customer each month, from months 1-x. Also, another way of calculating this would be finding the total COS for the time period and dividing by the average customers served during the same time period. Wouldn’t the cost to serve per month and the number of saas customers per month give the same insight into if adding more customers drives down your per unit costs?
2. On the second sheet, what is the purpose of keeping the ACS unit cost constant and then determining the unit cost/customer as a function of customers? Is this incremental customers? The ACS unit cost was derived assuming you had 1000/customers/month for the 1 year sample. What does this information tell us?