Recurring revenue businesses have become the stars of the investment world. Investors love stable, recurring revenue streams. Valuations are tied to the health of our recurring revenue.
But how do we measure the health of our recurring revenue? We use gross dollar retention (GDR) and net dollar retention (NDR).
As operators of our SaaS businesses, it’s critical to track, monitor, and improve the health of our recurring revenue streams. This data also becomes especially important in the due diligence process.
In this post, I will cover the how and why of gross dollar retention and net dollar retention, two key SaaS metrics for your SaaS business. Plus, I have a great Excel template download below that will perform all of the retention calculations for you.
How to Calculate to Gross Dollar Retention (GDR)
Gross dollar retention is lost dollars from your existing customer base. Lost dollars mean churn and downgrades. Churn is completely lost customers. Downgrades are the net dollars lost when a customer, for example, reduces the number of seats, modules, usage tiers, and so on.
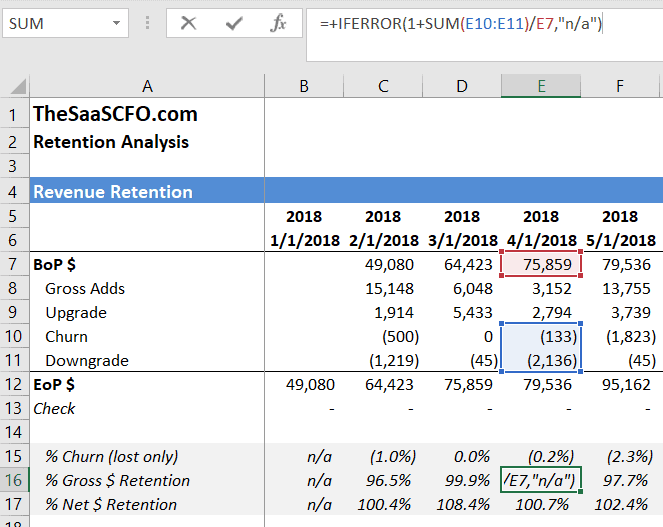
The formula to calculate GDR is below. I use MRR in the formula, but you can replace MRR with ARR if you think in ARR terms.

You can see how this formula works in practice in the screenshot below. We sum our churn and downgrade dollars and divide that by our beginning MRR balance (BoP $). In the example below, I am calculating GDR on a monthly basis. I also have a tab for an annual calculation.
Gross dollar retention maxes out at 100%. We cannot have GDR higher than 100%, because we are not taking credit for any expansion dollars. That’s net dollar retention which I’ll address next.

How to Calculate Net Dollar Retention (NDR)
Net dollar retention (also called net revenue retention) expands on the gross dollar retention theme. In addition to measuring churn and downgrades in the numerator, we now take credit for expansion MRR or ARR.
Expansion includes the net dollar increase from an up-sell or cross-sell of an existing customer. Let’s say Customer A pays us $12,000 per year. We cross-sell them Module B for $5,000 per year. Their total subscription is now $17,000. We include the $5,000 of expansion in the NDR formula.
Again, we are only focused on measuring the performance of our existing customer base. We do not include any dollars from new customers in the month.
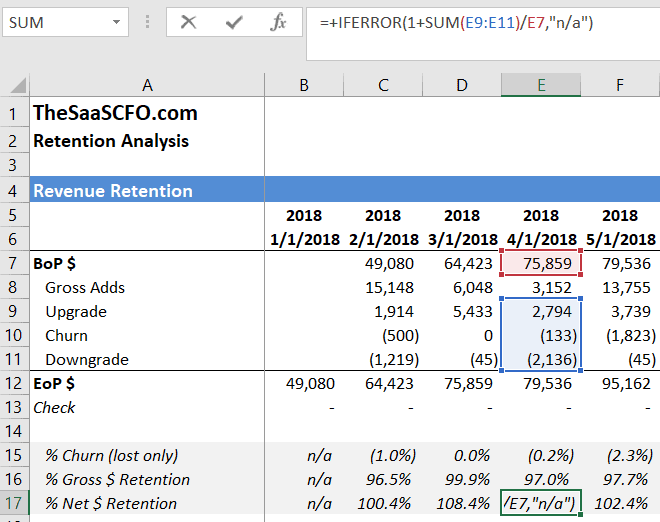
To calculate NDR, we count churn and downgrade MRR (just like GDR), but now we offset that dollar loss by expansion dollars.

You can see how this formula works in practice in the screenshot below. We sum our churn, downgrade, and expansion dollars and divide that by our beginning MRR balance (BoP $).
While gross dollar retention maxes out at 100%, net dollar retention can exceed 100%. Of course, we want our NDR percentage as high as possible.

Why Do We Care About GDR and NDR
Recurring revenue is the engine of our SaaS business. We must monitor the health of this engine and adjust the engine if performance declines.
Poor retention has several downline impacts. It leads to the following financial impacts.
- Lower customer lifetime values, because we use churn in the denominator of the LTV equation. Poor retention puts more pressure on your new business development team to perform.
- We need more new business bookings to offset churn and hit our revenue growth targets.
- It puts more pressure on gross margins, increases CAC payback periods, and stresses our P&L.
Revenue retention is also a key due diligence item if you are fundraising or selling your company. Higher net dollar retention will help your valuation, so make sure you have this data in order.
What Do I Do with the GDR and NDR Data
In my latest live metrics training session, we had a great discussion on interpreting the results of retention analysis. We calculated GDR and NDR. Now what do we do with it?
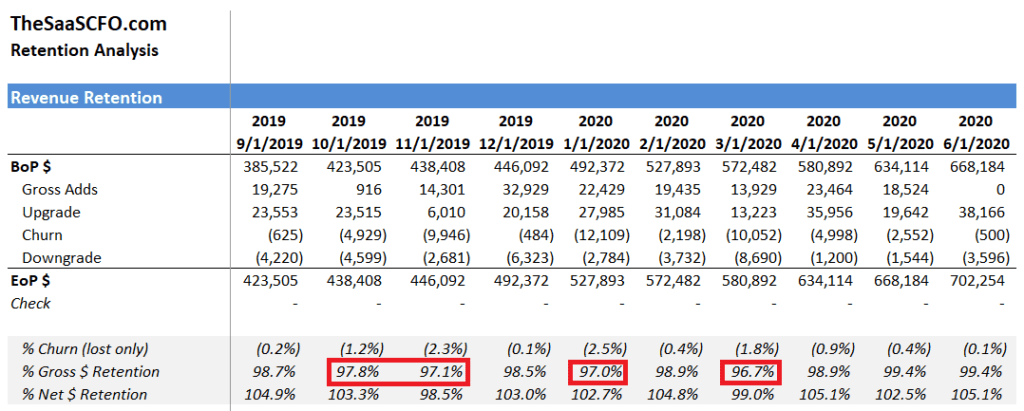
In the screenshot below, I highlighted in red several months where GDR appears to trend below historical averages. Students in my course asked, “what do I about this?”
My response…the numbers only tell you half the story. Sometimes there is an “aha” moment, but in this case, I monitor the numbers and take action when I see alarming trends.
If I see consistent declines or retention trending below historical averages, I will reach out to my customer success and product teams to fill in the other half of the story.
We need to marry the numbers to the operational story to tell the full financial story.
As a CFO, I must speak with operations to understand the complete story. What are the reasons for churn?
- Do we have onboarding issues?
- Do we have technical support issues?
- Do we have product issues?
- Do we have a cohort of customers who were not a good fit for our product?
With this information, I can determine what resources or investments might be required to stabilize and improve retention. I will also adjust my financial forecast accordingly and determine the impact to our margins, cash flow, and related SaaS metrics.

Next Steps
Start tracking your customer data in the format below. You can then paste your data into my revenue retention template to calculate your GDR, NDR, and logo retention metrics. You can also runs this analysis by product line, region, or any customer characteristic.

Just start tracking. Your data may not be great, but you can improve it over time. If you use Stripe to process payments, you can connect your subscription data to a tool such as Firstofficer.io.
Today, it’s not just subscription revenue anymore. Business models now include usage, consumption, or transaction pricing models to name a few. You can also analyze your other or primary recurring revenue streams with retention analysis.
Download the Excel template below.
I have worked in finance and accounting for 25+ years. I’ve been a SaaS CFO for 9+ years and began my career in the FP&A function. I hold an active Tennessee CPA license and earned my undergraduate degree from the University of Colorado at Boulder and MBA from the University of Iowa. I offer coaching, fractional CFO services, and SaaS finance courses.
